The XRecommend Analytics page provides comprehensive insights into the performance of your recommendation engine. The page is designed to help you monitor the impact of XRecommend on key business metrics, allowing for data-driven decision-making.
The top of the page includes navigation options to switch between different views: Overview, User Flow, and Product Insights. It also allows you to control parameters for your report.
Parameters
Locale: Select the locale or catalog you wish to report on
Experiences: Choose the experiences that you would like to have reports examine. Experiences are explained here
Date Range Selection: At the top right, you can set the start and end dates to filter analytics data. In this example, the date range is from February 6th to February 11th, 2025. All times are in UTC.
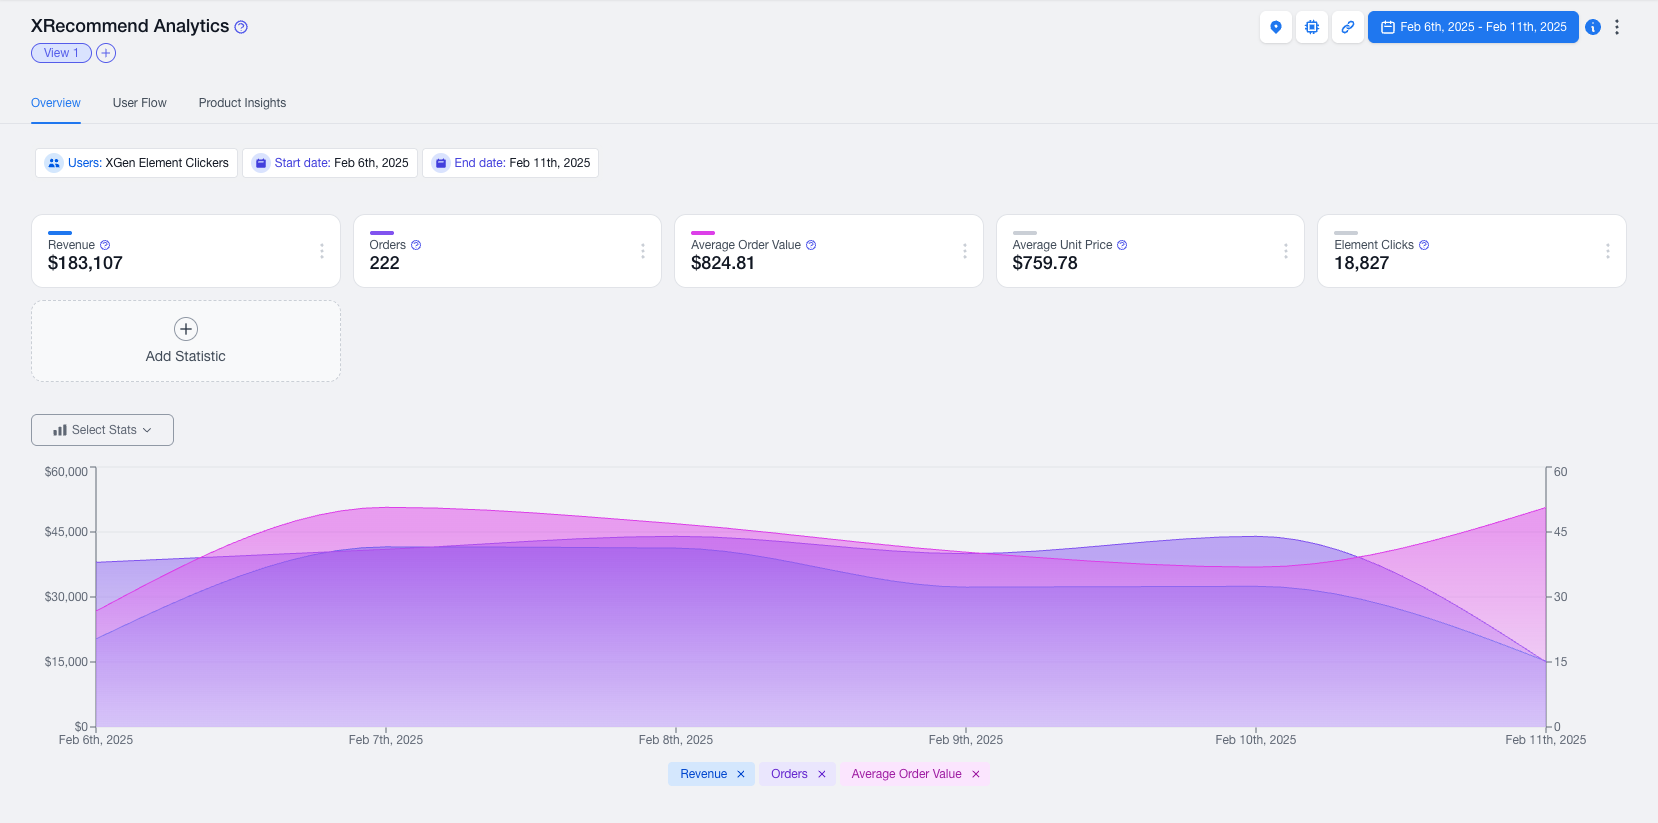
Overview Business Stats
The Overview page highlights essential stats relevant to your recommendation performance. For ease of reference, we categorized our roughly 30 standard metrics into two big buckets:
Revenue & Transaction Metrics
Product & Element Interactions
Revenue & Transaction Metrics
These metrics help assess the monetary value generated by user interactions and purchases.
Revenue: Total dollar value of orders
Average Order Value (AOV): Total revenue across all orders in a given time period
Formula: Total Revenue / Total Orders
Average Unit Price: The average price of items sold.
Formula: Total Revenue / Total Units Sold
Value Per User: Revenue generated per unique user.
Formula: Total Revenue / Unique Users
Orders: Number of completed transactions.
Units: Total number of items sold.
Units Per Transaction: Average number of items per order.
Formula: Total Units Sold / Total Transactions
Units Per User: Items purchased per unique user.
Formula: Total Units Sold / Unique Users
Unique Purchasers: Distinct users who made at least one purchase.
Buyer Percent: The percentage of users who made a purchase.
Formula: (Unique Purchasers / Unique Users) * 100
Conversion Rate (CR%): Proportion of users who made a purchase.
Formula: (Conversions / Total Visitors) * 100
Purchase Frequency: Average number of purchases per user over a given period.
Formula: Total Purchases / Unique Users
Add to Cart (ATC): Number of times users add items to the cart.
ATC Per User: Average number of cart additions per user.
Formula: Total ATC Actions / Unique Users
ATC Rate: Proportion of product views that result in ATC.
Formula: (ATC / Product Views) * 100
Unique Users: Add to Cart: Number of distinct users who added an item to their cart.
Product & Element Interactions
Metrics that measure how users interact with product pages and recommendation elements.
Element Impressions: The number of times an element (like a recommendation) is displayed.
Element Clicks: Total number of clicks on a recommendation or interactive element.
Click Through Rate (CTR): Proportion of element impressions that result in clicks.
Formula: (Element Clicks / Element Impressions) * 100
Unique Users: Impression: Number of distinct users who saw an element.
Unique Users to Impression Ratio: Percentage of unique users who see a recommendation compared to the total number of impressions.
Formula: (Unique Impressions / Total Impressions) * 100
Unique Users: Element Click: Number of distinct users who clicked an element.
Unique Users to Element Click Ratio: Measures the effectiveness of displayed content.
Formula: (Unique Element Clickers / Unique Element Impressions) * 100
Unique Users: Impression to Element Click Ratio: Efficiency of turning impressions into clicks.
Formula: (Unique Clicks / Unique Impressions) * 100
Product Views: Total number of times a product page was viewed.
Product Viewers: Unique users who viewed product pages.
Pageviews: Total count of pages viewed.
Product Views Per User: Average number of product views per unique user.
Formula: Total Product Views / Unique Users
Pages Per User: Average number of pages visited per unique user.
Formula: Total Pageviews / Unique Users
Combining Metrics for Deeper Insights
Example Reports
User Engagement Funnel
Combine Pageviews, Product Views, Element Clicks, and ATC to trace the user journey from browsing to cart addition.
Revenue Per Interaction
Calculate as Revenue / Element Clicks to determine the financial impact of each click on recommendations.
Interaction to Conversion Efficiency
Compare Click Through Rate (CTR) with Conversion Rate (CR%) to evaluate how well clicks translate into purchases.